
Dr. Alok Aggarwal
Transform Your Workflow with Scry AI Automation
Get StartedIt is impossible to overlook the massive profits investors have earned in the Indian market over the past several years.
However, beyond the tech-heavy activity that has driven much of these profits, there are many new and interesting
areas that private equity and venture capital firms are now aggressively looking to take advantage of. The Indian
market is certainly unique. A solid understanding of this market and some behavioral adjustments will be required
from investment players who are new to India in order to maximize the returns for their investors. In addition to the
required capital, proper research in a challenging market, subtle and savvy managerial skills, and a healthy dose of
patience must also be invested to ensure success. In this article, Evalueserve’s analysis shows that those who
manage the fundamentals and persevere stand to make significant gains in the years ahead. And, their impact will
not only be felt in India, but will have a significant impact the global economy as well.
Recent research conducted by the global research and analytics firm, Evalueserve, shows that if current trends continue, India will receive US $13.5 billion in Private Equity (PE) funding during 2007, ranking it among the top
seven countries in the world. And, this funding could rise to almost $20 billion in 2010. Our research also shows there are over 366 firms currently operating in India and another 69 have raised – or are in the process of raising – funds and are planning to start their operations soon1 . In total, these PE firms seem to have amassed US $48 billion
earmarked for investment in India between July 2007 and December 2010. Several firms that we talked to also
mentioned they would be willing to invest even more if they saw good investment opportunities. This situation stands
in stark contrast to 1996, when Indian companies only received a total of US $ 20 million. Indeed, if Indian companies do receive US $20 billion in funding during 2010, this would represent a stunning thousand-fold increase over a period of just fourteen years. Of course, the future is hard – if not impossible – to predict because private equity investments are based on a complex combination of macroeconomic, microeconomic, and financial policy-related factors that always affect the rational and emotional sentiments of the investor community. Indeed, a slow-down in growth of the Indian economy or a tightening of liquidity around the world are just two potential changes that could lead to substantially lower PE investment in India than those forecasted above.
From a demand-side perspective, assuming a real annual GDP (Gross Domestic Product) growth of 8%, an annual
inflation of 5% and a constant exchange rate of 40 Indian Rupees to the US Dollar2, our analysis shows that the
Indian economy will grow in nominal terms from approximately US $1,030 billion in 2007 to approximately $5,040
billion in 2020. Hence, it can easily absorb US $60 billion between 2007 and 2010 and as much as US $490 billion
between 2007 and 2020. However, for such investment to be useful and wealth creating, it has to be invested in
diverse sectors and not be limited only to Information Technology (IT) and IT Enabled Services (ITES) sectors.
Note: This article is largely focussed on Private Equity investment, i.e. investments in companies already generating
revenue and perhaps profit. A related article dated August 21, 2006 and titled, “Is the Indian VC Market Getting
Overheated?” can be downloaded from www.evalueserve.com and another article titled, “Investments by Hedge
Funds and Related Institutions in India” is scheduled to be published in December 2007.
Organization of the Paper
This article consists of six sections. In Section 2, we trace the growth of Private Equity (PE) in India from 1996 to the
first half of 2007, and also present our forecast for the next three and half years. Here, we also compare the PE
investment in India with a few other countries, particularly the United States, the United Kingdom and China. Section 3 discusses the break-up of this investment across different sectors and the number of individual deals of at least US $10 million in value, as well as the total value of PE deals during the past few years. Here, we will also discuss the recent trend of hedge funds investing in India. Sections 4 and 5 discuss the reasons for this increased PE funding which include the rapidly growing Indian economy, the rise of the Indian stock market, liberalization with respect to foreign direct investment into India, and the enormous potential for mergers and acquisitions that involve Indian companies. This section also discusses potential risks while investing in India. Finally, Section 6 discusses a few realities on the ground and best practices while investing in India.
Private Equity (PE) and Venture Capital (VC) firms usually raise capital from their Limited Partners (LPs) consisting
of high net worth individuals and institutional investors such as insurance companies, investment banks, pension
funds, and university endowment funds. These firms then invest this capital in yet-to-be-formed companies, in newly
formed companies, in private companies not listed on stock exchanges, and in public companies that are listed on
stock exchanges (wherein they make investments using “instruments” called PIPEs, i.e., Private Investment in Public
Equity or by simply buying equity shares in the stock market). Since most VC and PE funds have a hands-on
management style and are motivated by the old adage, “if you want something done right, do it yourself,” many times, they place their own people on the boards of these companies and allow them to control the business more firmly. Since these PE funds are not always able to have a majority control (especially in public companies) some funds specialize in being “activist funds” and engage the companies’ boards and management in discussion, wage proxy battles, liquidate assets, and even force the sale of some companies.
Venture Capitalists (VCs) usually invest in newly formed start-ups that may not yet have revenues or even a well-
developed product or service ready to sell. Hence, VCs usually bet on the founding or the executive teams, the total addressable market available for the product, and deep domain expertise. In fact, since many VCs were themselves entrepreneurs in the past, they continue to be driven by a “start-up” mentality (i.e., investing in a new innovation, developing a prototype product or service, and then making it robust enough for selling to bring in revenue) rather than a “growth via robust profits” mentality (i.e., increase revenue and profits by performing additional research and development, marketing and sales, and by other means).
In contrast, PE firms usually invest in companies that already have some revenue and that can potentially be grown
by restructuring, or by bringing new or improved products into existing or developing markets, or by otherwise
unlocking some of the intrinsic value within these companies. Of course, the eventual aim of a private equity firm is to either take the company public on a stock exchange or sell it so that the PE firm can free up its locked capital and
return some of it to its limited partners. Further, since many Private Equity managers come from diverse backgrounds such as strategy and operational consulting or investment banking, they are a bit more adept at investing in diverse sectors beyond only high-tech, biotech-pharmaceutical or a few other specific sectors.
Despite the key differences outlined above, at a broad level the business model for both VC and PE firms is
essentially the same. Typically, both groups charge their limited partners (LPs) a% as management fees for the
assets under management (where “a%” is usually 2%) and retain an additional b% of the profit from the initial
investment provided by their LPs (where “b%” is usually 20%).
Also, it is essentially the same group of limited partners that typically fund both VC and PE groups. In fact, many
traditional Venture Capital firms based in the United States and Europe are already investing US$ 10 million or more
today in India, and hence the separation between VC and PE investment in India has become very blurred.
Therefore, in this section, we consider the combined investment made by these two groups during the past few years.
In Section 3, we will only discuss the India investments made by these firms that are at least US $10 million each.
VC-PE investment during 1996-2006
Risk Capital Foundation seems to be the first VC-PE firm to start operations in India in 1975. During 1976-1995,
domestic financial institutions like Industrial Finance Corporation of India (IFCI), Industrial Development Bank of India (IDBI), and Industrial Credit and Investment Corporation of India (ICICI Bank) were some of the few private
organizations that provided any Venture Capital or Private Equity capital, and the actual investment made by them
was also negligible. During the period 1996-2000, several international and domestic VC and PE firms raised capital
internationally and started investing tiny amounts in India. For example, the total investment in India made by these
firms was only US $20 million in 1996 and US $80 million in 1997.
Even though PE-VC investment was only $20 million in 1996 and $80 million in 1997, the pace of growth was very
healthy largely due to the worldwide dot-com boom. Unfortunately, because this growth was driven by of the dot-com
bubble, it came crashing down soon after NASDAQ lost 60% of its value in 2000 – for example, the total number of deals declined from 280 in 2000 to 110 in 2001 – and this investment reached its low point both in the number of
deals and total value in 2003.
From 2003 onwards, India’s economy started growing at 8% to 9% annually in real terms and at 13% to 15% in
nominal terms (including inflation), and since some sectors (e.g., the services sector and the high-end manufacturing
sector) started growing at 10% to 14% a year in real terms and 15% to 20% in nominal terms, VC-PE firms started
investing again in 2004. For example, they invested US $1.65 billion in 2004, surpassing the investment of $1.16
billion in 2000 by 42%. Table 1 shows the number and value of deals in India during the period from 1996 to 2006.
Table 1: Number and Value of Deals 1996 – 2006 (in Million US $)

In addition, the exit climate for private equity investment in India improved significantly, and especially over the last
two years, the market witnessed several large and well-publicized exits. In addition to public equity markets (e.g.,
Genpact listing on NYSE and EXL on NASDAQ), private equity firms have also used secondary buy-outs or sale to
other private equity firms as exit.
Outlook for VC-PE investment during 2007-2010
Table 2 given below shows both the number of deals and the total dollars invested in India H1-2007 as well as
Evalueserve’s forecast for the number of deals and the total amount to be invested between H2-2007 and 2010. Our
analysis shows that if the current trends continue, India would receive US $13.5 billion in Private Equity funding
during 2007, thereby becoming one of the top seven countries receiving such funding in 2007. Furthermore, this
funding could rise to almost $20 billion in 2010. Our research also shows there are more than 366 firms currently
operating in India and another 69 are planning to start their operations soon. In total, they seem to have amassed US
$48 billion earmarked for investment in India during the next three and a half years, i.e.,
Table 2: Number and Value of Deals 1996 – 2006 (in Million US $)

July 2007 – December 2010, and several firms we have spoken to mentioned they would be willing to invest even
more if they saw good investment opportunities. Clearly, this is in stark contrast to 1996, when Indian companies only received US $20 million, and if indeed, Indian companies end up receiving US $20 billion in such funding then this would represent a thousand-fold increase between the fourteen years of 1996 and 2010. Of course, the future is
difficult to predict because private equity investments are based on a complex combination of macroeconomic,
microeconomic, and financial policy-related factors, which affect the rational and emotional sentiments of the investor community. Indeed, a slow-down in the growth of the Indian economy or a tightening of liquidity around the world are just two examples of changes that could lead to substantially lower PE investment in India than forecasted.
From a demand perspective, assuming an annual growth rate of 8%, annual inflation of 5%, and a constant
exchange rate of 40 Indian Rupees to one US Dollar, our analysis shows that the Indian economy will grow in
nominal terms from approximately US $1,030 billion during the calendar year 2007 to approximately $5,040 billion in 2020, and India can easily absorb US $60 billion during 2007-2010 and as much as US $490 billion during 2007-2020. However, for such investment to be valuable and wealth creating, it has to be broad-based and in diverse
sectors and not limited only to Information Technology (IT), IT Enabled Services (ITES), or the healthcare sector.
Interestingly, even though these sub-sectors seem to garner most of popular attention by many VC and PE firms, our
analysis shows they are not the biggest contributors to the growth of the Indian economy, and there are several other sub-sectors, which we will highlight later in the article that might yield better returns. Finally, even though many VC- PE firms have been focused on the IT and the ITES (IT Enabled Services, which includes the “Business Process Outsourcing” or the BPO sub-sector) sectors, a very important feature of the resurgence in the VC-PE activity in India since 2004 is that as a whole this community is no longer focusing only on these sectors. Figure 3 depicts the break- up of these investments with respect to the number of deals in 2000, and 2006 in various sectors.
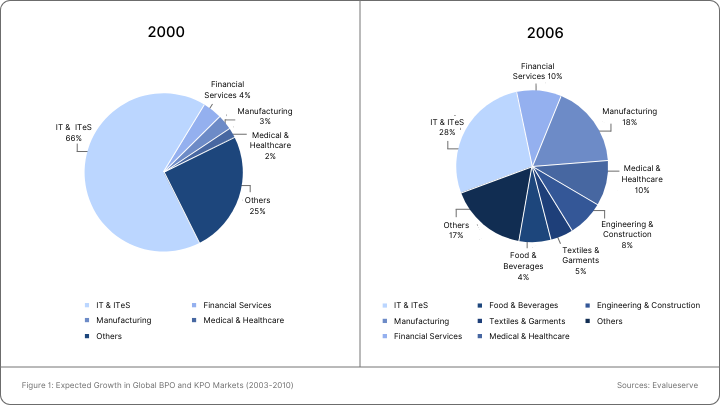
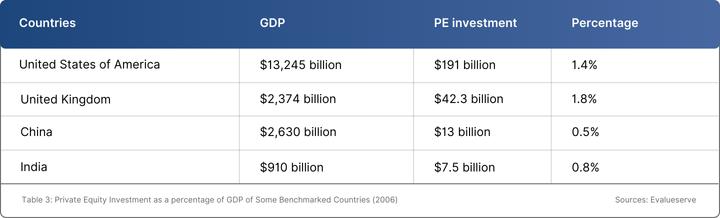
Table 3 depicts the percentage of VC and PE investments as a percentage of the Gross Domestic Product (GDP) in
the United States, United Kingdom, China and India for the year 2006. Interestingly, even after incorporating our
forecast of US $20 billion of PE investments in India in 2010, since the Indian economy is likely to be $1,490 billion
during that year, this investment would represent approximately 1.35% of India’s GDP and hence on a percentage
basis, it would be still be less than the United States.
In the United States and Europe, the typical PE investment threshold is considered to be $25 million. However, in
India, since wages are between one-third and one-sixth of the United States whereas most other costs like hardware,
software, machinery, office furniture, and real estate in the large cities are virtually the same), our analysis indicates
that the comparative benchmark for PE investment in India should be $10 million. Given this assumption, Table 5
provides a break-up both by the number of deals and their total value for the period from 2005 to H1-2007; it is worth noting that during this period, only 10% to 20% of the total amount invested in India was from VCs while the remaining was PE investment; this is very similar to 14% to 18% VC investment versus 82% to 85% Private Equity
investment in the United States.
Table 4: Number and Total Value of Deals (each over US $10 million) Between 2005 and H1-2007

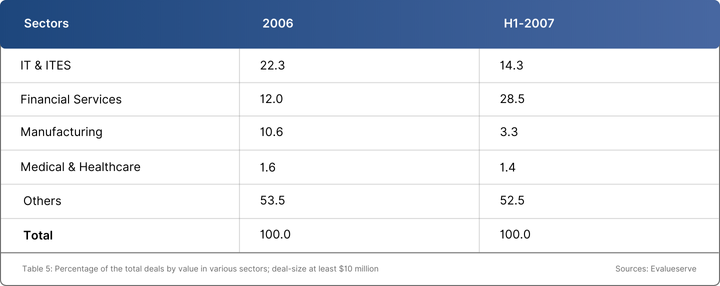
Similarly, if we only consider only those investments that are US $10 million or more and made in 2006 or H1-2007,
then Table 5 shows that these investments were even more broad-based than those in Figure 3.
Table 5: Percentage of the total deals by value in various sectors; deal-size at least $10 million
List of PE firms investing in India
Although PE firms like Baring Private Equity Partners, Warburg Pincus, CDC Capital, Draper International, HSBC
Private Equity, Chrys Capital (formerly known as Chrysalis Capital), and Westbridge Capital (now a part of Sequoia
Capital) were investing in India during 1996-2000, some of these firms, e.g., Westbridge Capital and Chrys Capital,
changed their strategy between 2003 and 2006 and moved from only venture investing to both venture and private
equity investing. Today, many traditional Venture Capital firms based in the United States and Europe are investing
US$ 10 million or more in India, and hence the separation between VC and PE investment in India has become very
blurred. Evalueserve’s research shows there are 366 such firms claiming to be operating in India and another 69 that
are raising capital with plans to be operating soon.
Current status of Hedge Fund investing in India
Usually, a hedge fund’s strategy is to “hedge” its bets, for example, by going “long” with respect to some of its
investments and “short” with respect to others. Given this strategy, most hedge funds typically buy and sell a set of
shares/equities or other instruments and constantly trade these to generate returns over a six to eighteen-month
period. Furthermore, because of their hedging strategy, usually these funds have a fairly high threshold for high-risk
opportunities, and by taking such risks they are often able to generate fairly high returns for their limited partners.
According to our analysis, currently there are more than 10,200 hedge funds worldwide, which cumulatively have
more than $1,800 billion under management. Interestingly, of this amount, $1,200 billion is being managed by only
the top 250 hedge funds. Since VC, PE and other alternative investment-related firms also have approximately
$1,800 billion under management, together these two groups currently manage approximately 6% of all assets under
management worldwide. Consequently, the “law of large numbers” seems to be gradually creeping up and it is
becoming harder for many hedge funds to find good opportunities. Hence many hedge funds are beginning to act like
PE firms investing with a “longer time horizon”, especially in India. Some well-known hedge funds investing in India
include D. E. Shaw Group, Farallon Capital Management, Old Lane Management (now a part of Citi-Alternative Investments), Galleon Group, Monsoon Capital, and Tiger Global Management. A few other hedge funds operating in
India can be found at http://www.evalueserve.com/Media-And-Reports/WhitePapers.aspx
Most hedge funds investing in India are not registered as Foreign Institutional Investors (FIIs) and are therefore not
allowed to trade Indian stocks directly. Hence they get exposure to Indian stocks (by using equity swaps, Contract for
Differences or CFDs, Promissory Notes or P-Notes, etc.) through large global brokers and custodians like Merrill
Lynch, Morgan Stanley, Goldman Sachs, Bear Sterns, and Citibank. Furthermore, their trading costs through these
brokers and custodians in India are quite high since these costs involve those related to brokerage fees, statutory
charges, and commissions. Although some of these costs have come down lately, the commissions alone are still
50-60 basis points (i.e., 0.5% – 0.6% of the tradeable value) as compared with 3 to 4 basis points in the United States.
Furthermore, the financing cost for short positions in Indian stocks is much higher than for long positions. Finally, the Indian stock market, which is represented by the Sensex (see Section 4 for more details), has quadrupled during the last four years giving very little incentive to “short” most stocks that are available with these custodians. Hence, unlike the US, where these hedge funds buy and sell continuously, most hedge funds in India do not participate in short movements related to any major indices or stocks, and to that extent do not create volatility in the Indian stock
market.
Given this backdrop, at least for now, most hedge funds have decided to go “long” only with respect to the Indian
public markets and some of them have even taken substantial equity in some private companies in India, thereby,
following a strategy almost identical to typical Private Equity groups. Of course, this strategy could easily change
because such a large rise eventually increases the incentive to short, thereby benefiting from a correction if the
Indian stock market becomes stagnant for some time or fluctuates wildly as it did between 1992 and 2002.
Since its independence in 1947 and until 1991, the Indian government largely pursued socialistic economic policies
that severely restricted economic freedom and trade – both domestically and globally. Hence, it is not surprising that
the Indian economy grew at an average of 3.5% annually during this period. However, in 1991, the government
started liberalizing the Indian economy and the country’s annual growth rate began rising substantially. It reached
9 % in 2005 and crossed 9.2 % in 2006. Evalueserve’s analysis shows that, given the current environment and
macroeconomic factors and barring any major calamity (e.g. a natural disaster or a war), India’s annual growth rate
of 8% is likely to continue until 2020. On the other hand, during the last seventeen years, i.e., 1991–2006, annual
inflation – as measured by the average wholesale price index (WPI) price index – has been approximately 6.67%,
and given the savings rate and liquidity in the system, our analysis also shows that the annual inflation in India is
likely to hover around 5% during the next fourteen years. So, assuming a constant exchange rate where one US
Dollar equals 40 Indian Rupees, the Indian economy that was approximately $800 billion in 2005 and $910 billion in 2006 is likely to be $1,030 billion in 2007, $1,490 billion in 2010 and around $5,040 billion in 2020 (all in nominal terms). This implies that including inflation, there will be more than a five-fold increase in India’s economy between 2007 and 2020.
During 2006, the services sector accounted for approximately 55% of the economy, the manufacturing and
industries’ sector contributed about 26%, and agriculture about 19%. Furthermore, both the services and the
industries sectors have been growing at approximately 10% annually during the last three years, which after
including inflation (of 5%) implies an average annual growth of 15%. Given this backdrop, we briefly mention three
groups of industry verticals below that are likely to be lucrative for the VC, PE and HF communities, especially
because cumulatively, they are likely to contribute approximately 6.5% of the growth or about half of the total nominal growth of 13% per year.
Three groups of rapidly growing sectors
The first group that is likely to exhibit rapid growth consists of hi-tech services and products, most of which are
currently being exported but some of which are also being consumed domestically. These hi-tech services and
products include Information Technology (IT) and application development, Business Process Outsourcing (BPO),
Knowledge Process Outsourcing (KPO), Drug Research and Clinical Research Outsourcing (CRO), Engineering
Services Outsourcing (ESO), software and solutions related to the consumer internet, software as a service (SAAS), Open Source, Software-Cum-Services, and telecommunications (both wireless and wire-line) products and related
services. This combined group of products and services is expected to grow at approximately 22% per year during
the next five years, and it is likely to contribute about 1.3% out of a total growth of 13% per year, i.e., approximately
10% of the total growth of the Indian economy. Furthermore, from a Private Equity investment perspective, it is worth noting that this group only constitutes approximately 1.3/6.5, or 20%, of the growth of these three groups combined.
The second group consists of services that are mainly geared towards the Indian domestic market although in almost
all cases, people visiting India can also benefit from them. These sectors include the retail sector, travel and
hospitality sector (e.g., airlines, hotels, theme parks), the health care sector (including medical tourism, alternative
medicinal centres and spas, hospitals, pharmacies and laboratories), the entertainment sector (including the Indian
movie and the TV industry), and the private education sector. Not surprisingly, this combined group of services and
productized services is likely to grow at approximately 19% per year during the next five years, and is likely to
contribute about 2.7% out of a total nominal growth of 13% per year (including 5% annual inflation).
Finally, the third group consists of products and services related to high-end manufacturing and infrastructure and it
includes automobiles, automotive components, electrical and electronic components, speciality chemicals,
pharmaceuticals, gems and jewellery, textiles, and sectors related to construction, real estate and infrastructure. This
combined group of products and services is likely to grow at approximately 19% per year during the next five years,
and is likely to contribute about 2.5% out of a total nominal growth of 13% per year.
The growth of the Indian stock market
As of June 30, 2007, there were 23 government-recognized, stock exchanges in India and there were more than
9,700 companies listed on these exchanges. Among these, the Bombay Stock Exchange (BSE) had 4,842 listed
companies, and this exchange happens to be the oldest exchange in Asia having been established as “The Native Stock Brokers Association” in 1875. Since BSE has the most well known indices within the Indian stock
market, we focus on a few of these indices in this article.
Figure 2 depicts three indices, Sensex or “Sensitive Index” (with a base of 100 in 1979 and comprises of the 30
companies listed on BSE), BSE-100 (with a base of 100 in 1984 and comprises of 100 stocks listed at five major
stock exchanges in Mumbai, Calcutta, Delhi, Ahmedabad and Chennai), and BSE-500 (with a base of 1,000 in 1999
and comprises of 500 listed companies in various Indian stock exchanges). Ignoring dividends, both Sensex and
BSE-100 have grown by 12.5% annually in US Dollar terms between June 1990 and June 2007, although they have
fluctuated fairly wildly during this period.

The 12.5% annual growth rate for Sensex and BSE-100 during the last seventeen years (in USD terms) consists of
the following two sub-components:
Given that most of the companies comprising the Sensex, BSE-100, and BSE-500 are likely to grow at an average
annual rate of 11% – 12% during the next 4-5 years, these three indices may grow by at least 11% – 12% on an
annual basis. On the other hand, since the average Price/Earnings ratio of the corresponding companies is
substantially more than those in several other emerging markets (where the P/E ratios have generally continued to
hover around 12-13 for the past two decades), it is quite possible that the Indian companies listed in these three
indices are overpriced and they may not grow at all or may even drop precipitously. Finally, given the past history of
these indices, especially during 1992-2002, it is also possible that these indices would continue to fluctuate in the
near future (especially if the Indian government curbs the liberalizing of the economy or if the global economy cools
down.)
Although the eight-year period of June 1999 to June 2007 is a rather short duration for the Indian stock market, it is still worth noting that during this period, the annual price return in US Dollar terms for Sensex, BSE-100 and BSE- 500 was 18%, 21% and 25%, respectively, which implies that the 400 hundred companies in the BSE-500 but not in the BSE-100 grew much faster, and on an average these companies became more productive and/or grew more
rapidly than those in the Sensex or BSE-100.
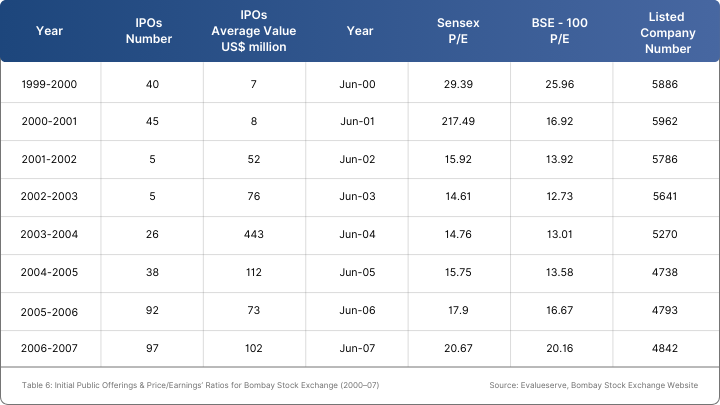
Table 6 depicts the number of companies listed on the BSE between June 1999 and June 2007. Not surprisingly, the
number of Initial Public Offerings (IPOs) on the BSE went down dramatically during the 2001-2003 period because of the dot-com bust and because of the NASDAQ crash of 2000. However, this number has been growing again since
2004 and is expected touch a new record in 2007. Despite the fact that almost 250 companies were listed on BSE
during this period, 1,250 companies were de-listed because of performance and the legacy of the dot-com era.
Finally, although US $10 million or less was being raised during a typical IPO in 2000 and 2001, this amount has
been increasing steadily, which indicates that earlier companies were using BSE as an alternative for raising Venture
Capital Funding, but now many of them are using it as an alternative for raising Private Equity Funding. Indeed, many smaller Indian companies are going to the other 22 stock exchanges in India to raise smaller amounts and using those exchanges as alternate means for raising capital.
Table 6: Initial Public Offerings & Price/Earnings’ Ratios for Bombay Stock Exchange (2000–07)
Most VC and PE firms have a time horizon of five to seven years in the United States and Europe, and they expect to
provide an average net annual return of 13% to 15%, i.e., double the investment of their limited partners in
approximately five years. However, the PE firms currently operating in India seem to have a time horizon of three to
five years and their expectation of an average net annual return is between 25% and 27%, i.e., double the
investment of their limited partners in three years. These elevated expectations can be attributed to the following key
factors:
However, given that so many Venture Capital, Private Equity and Hedge Funds are beginning to invest actively in India, good investment opportunities will become more difficult to find, and hence, an annual return that is 7% to 9% more than that of Sensex or BSE-100 (i.e., 18% to 20% per year assuming Sensex and BSE-100 continue to grow at
10% to 12% per year) seems to be a more likely scenario, in which case the principal amount is likely to be double in four years (and not three). In light of this analysis, Evalueserve believes there are some key opportunities and short- term risks while investing in India:
As discussed in Section 4, the Indian stock market, which is epitomized by the Sensex, BSE-100 and BSE-500, has
been growing at approximately 42% annually in nominal terms since June 2003, and has thus more than quadrupled
in four years. Although this growth rate is likely to slow to a more reasonable level, there will still be substantial
opportunities for VC, PE and HF firms to do substantial research and cherry-pick companies that are growing
annually at 25% or more (including the 5% inflation). Incidentally, when it comes to cherry-picking such opportunities, Chrys Capital has done an excellent job between 2003 and 2007. Before 2003, Chrys Capital used to mainly provide VC financing to start-ups and smaller companies. However, it changed its strategy and started investing between $20 million and $200 million in 2003. Furthermore, it became an activist fund (see Section 2 for definition), started providing growth investment to medium and large private companies, and its average annual return on investments during the past four-year period has been over 50% per year.
Public Sector Undertakings (PSUs)
The Indian economy was a socialistic economy between 1947 and 1991. As a result, the Indian government owned
many companies – called Public Sector Undertakings ( PSUs) – especially in the following sectors that were
considered critical to the Indian economy: financial services (e.g., those in banking and insurance), utilities (e.g.,
those in electricity, oil, gas, telecommunications), capital goods (e.g., those related to earth movers, electronics,
heavy electrical), transport services (e.g., those related to airports, railroad, containers, shipping), and metals and
mining (e.g., those in aluminium, steel, and copper). However, gradually the Indian government has been reducing its stake in many PSUs and now owns only 51% in some of them. In fact many of these are currently listed on the Indian stock market and the enterprise value of just the top 42 PSUs listed on BSE, which constitute a BSE-PSU index with a datum of 1000 on February 1, 1999, currently exceeds $210 billion.
Not surprisingly, these PSUs were quite inefficient before the Indian government privatized them (at least partially).
However, just like the BSE-500, the 42 PSUs comprising the BSE-PSU index have become significantly more
efficient and productive as indicated by the data given below:
Although these productivity and efficiency improvements seem very impressive, there is still room for further
improvement – according to Evalueserve’s estimates by as much as 60% – within these 42 PSUs, and even more
within the other PSUs that do not constitute to the BSE-PSU index. Furthermore, since the Indian government is
planning on opening the banking sector completely to foreign competition (by 2009) and is also planning on further
liberalizing other sectors – e.g., metals and mining, utilities, and capital goods’ sectors – these PSUs do not have any
choice but to become more productive, efficient and aggressive with respect to both organic growth and acquisitions.
Hence, these PSUs provide a good opportunity especially for the activist PE and HF firms that can help these PSUs
grow to the next level. Of course, since most of these PSUs are still quite hierarchical, bureaucratic, and stodgy and
usually have a disdain for taking any advice or being influenced by third parties, the Private Equity firms would have
to patiently “weave” their way into them to effect appropriate change.
The following examples show that at least some PE firms are beginning to get interested in this sector:
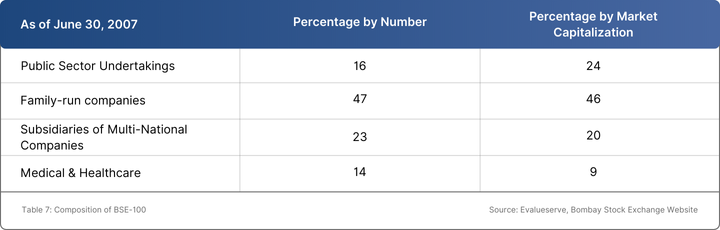
Family-run businesses
Some of the most profitable, efficient and productive companies in India – e.g., those run by the Tatas, Ambanis,
Premjis (Wipro), Birlas, Singhs (Ranbaxy) and Bajajs – are family-run businesses. As shown in Table 7, 47 of the
BSE-100 companies are partially or wholly family-run businesses and had a total market capitalization of $345 billion as of June 2007. Despite such impressive statistics, our analysis shows that the examples above seem to be
noteworthy exceptions. By and large, a majority of family-run businesses do not succeed. In fact, over the last fifty
years, more than 70% of for-profit organizations in India were started as family-run businesses and corporations, but
less than two-thirds survived the first five years and only one-third survived the next twenty. This is because these
businesses suffer from a lack of effective corporate governance, lack of management structure and often a lack of
vision to expand domestically or globally. Consequently, an investment in such companies could be a win-win for
them as well as for the PE firms. However, for this strategy to really succeed, the PE managers should be able to
bring not only capital but also their strategy and operational expertise to bear, and they may have to work in “deep
and dirty trenches” along with these business families and their management teams.
As mentioned in Section 2, the eventual aim of a private equity firm is to either take the company public (i.e., list it on
a stock exchange) or sell it so the PE firm can free up its locked capital and provide a return to its limited partners.
Given the rapid growth of PE investments and the rapid consolidation of some of the more maturing industries (e.g.,
IT and IT Enabled Services), the M&A activity within India is already growing quite substantially. Furthermore, since
Indian companies are now becoming more confident of acquiring and successfully integrating non-Indian companies, this M&A activity is likely to grow even faster. Clearly, since many PE managers have investment banking and consulting backgrounds, they can certainly help their portfolio companies during this process.
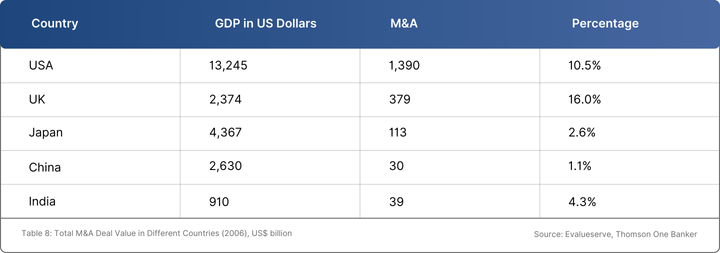
For the year 2006, Table 8 compares the total value of deals in India as a percentage of India’s GDP to those in the
United States, United Kingdom, Japan and China. On a percentage basis, Indian companies are ahead in Mergers
and Acquisitions (M&A) when compared to China and Japan but they still have some distance to go to catch the
United States or the United Kingdom.
Table 8: Total M&A Deal Value in Different Countries (2006), US$ billion
Another opportunity for the Private Equity industry is in either buying – or helping their portfolio companies to buy captive units of multi-national or domestic companies that are likely to be spun off from their parent companies.
British Airways started this trend in 2002 when it decided to sell a majority stake of its IT Enabled Services (ITES)
captive unit in India called WNS Global Services to Private Equity firm, Warburg Pincus. General Electric followed
suit two years later by selling its captive unit (now called Genpact) to General Atlantic and Oakhill Capital Partners.
These two companies, WNS and Genpact, recently went public on the New York Stock Exchange and currently have
a market valuation of more than US $700 million and $3 billion, respectively. More recently, The Netherlands based
company, Philips, sold its ITES unit to Infosys and currently Citigroup is negotiating with several firms to sell its ITES captive unit, eServe. Indeed, it is not surprising that several PE firms are involved in negotiations with Citigroup in buying eServe wholly or partially for one of their portfolio companies or to create an entirely new company. At Evalueserve, we believe that during the next three to four years, between 20 to 30 multinational companies are likely to sell – partially or wholly – their captive units since the main tasks performed within such captive units seem to be proper hiring, training, retaining of personnel and providing high-quality processes and services, which these multinationals do not consider as their “core” business.
Short-term risks while investing in India
Since the Indian economy has been growing at a fairly rapid pace, particularly between July 2003 and June 2007,
this growth may be overheating its economy. The following are several short-term risks worth investigating:
On-the-Ground Realities and Best Practices for PE Investing in India
This section advocates a number of best practices and highlights some of the key differences between private equity
investing in India versus the US or Europe.
Find “diamonds in the rough” and then help polish them
The five hundred companies comprising the BSE-500 are likely to have revenues of approximately $360 billion in
2007. Furthermore, as mentioned in Section 4, since June 1999, these companies have been performing better than
the hundred companies comprising BSE-100 or the thirty companies comprising Sensex. In some ways, these
companies do not have much choice if they want to emerge as winners during the liberalization of the Indian
economy.
In addition to the BSE-500, our analysis shows there are another 22,000 for-profit organizations (i.e., companies,
partnerships, and family-run businesses) that would earn approximately $135 billion in revenue in 2007 and most of these are facing the same challenges with respect to growth, productivity, and efficiency. However, at least one-
fourth (at least 5,500) of these companies either have good processes or unique Intellectual Property that is likely to make them winners but they are “diamonds in the rough” and suffer from the following drawbacks:
Clearly, finding such companies and doing due-diligence on them is more challenging in India as compared to US or
Europe markets because there is very little market research available and because these companies and even the
corresponding sub-sectors may not be very transparent. Furthermore, since most of these companies may not
appear on the “radar screens” of the big strategy and management consulting firms (e.g., McKinsey and Company,
Bain & Company, etc.), the PE managers would have to either perform this research themselves or employ global
research firms with a strong presence and experience in India (e.g., Evalueserve) to do this research. Finally, these
PE firms would also have to find senior and experienced professionals in India, who may have worked in the
corresponding sub-sectors capable of conducting thorough SWOT (Strengths, Weaknesses, Opportunities and
Threats) analyses. We believe that such India-based on the ground analysis may cost a PE firm between $25,000
and $50,000 for a specific sub-sector and/or a specific company – but with investments likely to be $10 million or
more, this should be money well spent.
Diversify, diversify, and then diversify a bit more
Given that many managers in the VC and PE firms come from science and technology backgrounds, they are
instinctively attracted to the high-tech industry. However, as mentioned in Section 4, this area is likely to contribute
only 10% of the overall growth of the Indian economy, and will contribute only 20% to the growth of the three fast
growing areas mentioned in Section 4. On the other hand, even though deals in the IT and ITES sector dropped from
65.5% in 2000 to 28.8% in 2006 (see Table 3), IT and IT Enabled Services (ITES) constitutes only a sub-sector of
the overall high-tech sector, and this sub-sector is getting overheated with valuations of many – if not most –
companies running at 30 to 50 times their earnings. In contrast to this, the Sensex is only trading at 21 times
earnings. Furthermore, because of the availability of cheap capital, many “lemming” companies have started during
the last four years in the IT and ITES sector, but most may not survive the next three years. Incidentally, even within
the IT and ITES sub-sector, there are sub-sectors (e.g., open source, robotics related to machine tools, and
animation) that have largely remained untouched so far by the PE industry in India.
New sub-sectors are emerging in the Indian economy
As the disposable income for the middle and rich classes is increasing, their changing habits and tastes are leading
to the creation of new sub-sectors, eco-systems, and supply chains. For example:
India is neither the United States nor China
Although it is fashionable these days to compare India and China, actually the two countries are quite different.
Indeed, a lot of progress in China is because of the government whereas that in India it is despite the government.
For example, the communist government in China can easily plan projects in a very structured and systematic
manner without worrying about the courts or public opinion, whereas most projects in India get delayed because of
Indian courts and because of strong public opinion. Similarly, although India and the United States share democracy
as one of their fundamental tenets, India is a poor country with a severely underdeveloped infrastructure, whereas
the US is one of the wealthiest countries with a very well developed infrastructure. Because of these reasons, it
behoves VC and PE firms to consider investing in Indian companies “in their own right” rather than pursuing the
following strategy: “if it has worked in the US or China, it will work in India too.” Given below are examples of three
companies that are likely to cater only to countries like India:
Again, it is quite likely that at least one company would emerge with $250 million or more in revenue and will
begin exporting in a big way to other regions in Africa and South East Asia.
Blog Written by
CEO, Chief Data Scientist at Scry AI
Author of the book The Fourth Industrial Revolution
and 100 Years of AI (1950-2050)
At Scry Analytics Inc ("us", "we", "our" or the "Company") we value your privacy and the importance of safeguarding your data. This Privacy Policy (the "Policy") describes our privacy practices for the activities set out below. As per your rights, we inform you how we collect, store, access, and otherwise process information relating to individuals. In this Policy, personal data (“Personal Data”) refers to any information that on its own, or in combination with other available information, can identify an individual.
We are committed to protecting your privacy in accordance with the highest level of privacy regulation. As such, we follow the obligations under the below regulations:
This policy applies to the Scry Analytics, Inc. websites, domains, applications, services, and products.
This Policy does not apply to third-party applications, websites, products, services or platforms that may be accessed through (non-) links that we may provide to you. These sites are owned and operated independently from us, and they have their own separate privacy and data collection practices. Any Personal Data that you provide to these websites will be governed by the third-party’s own privacy policy. We cannot accept liability for the actions or policies of these independent sites, and we are not responsible for the content or privacy practices of such sites.
This Policy applies when you interact with us by doing any of the following:
What Personal Data We Collect
When attempt to contact us or make a purchase, we collect the following types of Personal Data:
This includes:
Account Information such as your name, email address, and password
Automated technologies or interactions: As you interact with our website, we may automatically collect the following types of data (all as described above): Device Data about your equipment, Usage Data about your browsing actions and patterns, and Contact Data where tasks carried out via our website remain uncompleted, such as incomplete orders or abandoned baskets. We collect this data by using cookies, server logs and other similar technologies. Please see our Cookie section (below) for further details.
If you provide us, or our service providers, with any Personal Data relating to other individuals, you represent that you have the authority to do so and acknowledge that it will be used in accordance with this Policy. If you believe that your Personal Data has been provided to us improperly, or to otherwise exercise your rights relating to your Personal Data, please contact us by using the information set out in the “Contact us” section below.
When you visit a Scry Analytics, Inc. website, we automatically collect and store information about your visit using browser cookies (files which are sent by us to your computer), or similar technology. You can instruct your browser to refuse all cookies or to indicate when a cookie is being sent. The Help Feature on most browsers will provide information on how to accept cookies, disable cookies or to notify you when receiving a new cookie. If you do not accept cookies, you may not be able to use some features of our Service and we recommend that you leave them turned on.
We also process information when you use our services and products. This information may include:
We may receive your Personal Data from third parties such as companies subscribing to Scry Analytics, Inc. services, partners and other sources. This Personal Data is not collected by us but by a third party and is subject to the relevant third party’s own separate privacy and data collection policies. We do not have any control or input on how your Personal Data is handled by third parties. As always, you have the right to review and rectify this information. If you have any questions you should first contact the relevant third party for further information about your Personal Data.
Our websites and services may contain links to other websites, applications and services maintained by third parties. The information practices of such other services, or of social media networks that host our branded social media pages, are governed by third parties’ privacy statements, which you should review to better understand those third parties’ privacy practices.
We collect and use your Personal Data with your consent to provide, maintain, and develop our products and services and understand how to improve them.
These purposes include:
Where we process your Personal Data to provide a product or service, we do so because it is necessary to perform contractual obligations. All of the above processing is necessary in our legitimate interests to provide products and services and to maintain our relationship with you and to protect our business for example against fraud. Consent will be required to initiate services with you. New consent will be required if any changes are made to the type of data collected. Within our contract, if you fail to provide consent, some services may not be available to you.
Where possible, we store and process data on servers within the general geographical region where you reside (note: this may not be within the country in which you reside). Your Personal Data may also be transferred to, and maintained on, servers residing outside of your state, province, country or other governmental jurisdiction where the data laws may differ from those in your jurisdiction. We will take appropriate steps to ensure that your Personal Data is treated securely and in accordance with this Policy as well as applicable data protection law.Data may be kept in other countries that are considered adequate under your laws.
We will share your Personal Data with third parties only in the ways set out in this Policy or set out at the point when the Personal Data is collected.
We also use Google Analytics to help us understand how our customers use the site. You can read more about how Google uses your Personal Data here: Google Privacy Policy
You can also opt-out of Google Analytics here: https://tools.google.com/dlpage/gaoptout
We may use or disclose your Personal Data in order to comply with a legal obligation, in connection with a request from a public or government authority, or in connection with court or tribunal proceedings, to prevent loss of life or injury, or to protect our rights or property. Where possible and practical to do so, we will tell you in advance of such disclosure.
We may use a third party service provider, independent contractors, agencies, or consultants to deliver and help us improve our products and services. We may share your Personal Data with marketing agencies, database service providers, backup and disaster recovery service providers, email service providers and others but only to maintain and improve our products and services. For further information on the recipients of your Personal Data, please contact us by using the information in the “Contacting us” section below.
A cookie is a small file with information that your browser stores on your device. Information in this file is typically shared with the owner of the site in addition to potential partners and third parties to that business. The collection of this information may be used in the function of the site and/or to improve your experience.
To give you the best experience possible, we use the following types of cookies: Strictly Necessary. As a web application, we require certain necessary cookies to run our service.
We use preference cookies to help us remember the way you like to use our service. Some cookies are used to personalize content and present you with a tailored experience. For example, location could be used to give you services and offers in your area. Analytics. We collect analytics about the types of people who visit our site to improve our service and product.
So long as the cookie is not strictly necessary, you may opt in or out of cookie use at any time. To alter the way in which we collect information from you, visit our Cookie Manager.
A cookie is a small file with information that your browser stores on your device. Information in this file is typically shared with the owner of the site in addition to potential partners and third parties to that business. The collection of this information may be used in the function of the site and/or to improve your experience.
So long as the cookie is not strictly necessary, you may opt in or out of cookie use at any time. To alter the way in which we collect information from you, visit our Cookie Manager.
We will only retain your Personal Data for as long as necessary for the purpose for which that data was collected and to the extent required by applicable law. When we no longer need Personal Data, we will remove it from our systems and/or take steps to anonymize it.
If we are involved in a merger, acquisition or asset sale, your personal information may be transferred. We will provide notice before your personal information is transferred and becomes subject to a different Privacy Policy. Under certain circumstances, we may be required to disclose your personal information if required to do so by law or in response to valid requests by public authorities (e.g. a court or a government agency).
We have appropriate organizational safeguards and security measures in place to protect your Personal Data from being accidentally lost, used or accessed in an unauthorized way, altered or disclosed. The communication between your browser and our website uses a secure encrypted connection wherever your Personal Data is involved. We require any third party who is contracted to process your Personal Data on our behalf to have security measures in place to protect your data and to treat such data in accordance with the law. In the unfortunate event of a Personal Data breach, we will notify you and any applicable regulator when we are legally required to do so.
We do not knowingly collect Personal Data from children under the age of 18 Years.
Depending on your geographical location and citizenship, your rights are subject to local data privacy regulations. These rights may include:
Right to Access (PIPEDA, GDPR Article 15, CCPA/CPRA, CPA, VCDPA, CTDPA, UCPA, LGPD, POPIA)
You have the right to learn whether we are processing your Personal Data and to request a copy of the Personal Data we are processing about you.
Right to Rectification (PIPEDA, GDPR Article 16, CPRA, CPA, VCDPA, CTDPA, LGPD, POPIA)
You have the right to have incomplete or inaccurate Personal Data that we process about you rectified.
Right to be Forgotten (right to erasure) (GDPR Article 17, CCPA/CPRA, CPA, VCDPA, CTDPA, UCPA, LGPD, POPIA)
You have the right to request that we delete Personal Data that we process about you, unless we need to retain such data in order to comply with a legal obligation or to establish, exercise or defend legal claims.
Right to Restriction of Processing (GDPR Article 18, LGPD)
You have the right to restrict our processing of your Personal Data under certain circumstances. In this case, we will not process your Data for any purpose other than storing it.
Right to Portability (PIPEDA, GDPR Article 20, LGPD)
You have the right to obtain Personal Data we hold about you, in a structured, electronic format, and to transmit such Personal Data to another data controller, where this is (a) Personal Data which you have provided to us, and (b) if we are processing that data on the basis of your consent or to perform a contract with you or the third party that subscribes to services.
Right to Opt Out (CPRA, CPA, VCDPA, CTDPA, UCPA)
You have the right to opt out of the processing of your Personal Data for purposes of: (1) Targeted advertising; (2) The sale of Personal Data; and/or (3) Profiling in furtherance of decisions that produce legal or similarly significant effects concerning you. Under CPRA, you have the right to opt out of the sharing of your Personal Data to third parties and our use and disclosure of your Sensitive Personal Data to uses necessary to provide the products and services reasonably expected by you.
Right to Objection (GDPR Article 21, LGPD, POPIA)
Where the legal justification for our processing of your Personal Data is our legitimate interest, you have the right to object to such processing on grounds relating to your particular situation. We will abide by your request unless we have compelling legitimate grounds for processing which override your interests and rights, or if we need to continue to process the Personal Data for the establishment, exercise or defense of a legal claim.
Nondiscrimination and nonretaliation (CCPA/CPRA, CPA, VCDPA, CTDPA, UCPA)
You have the right not to be denied service or have an altered experience for exercising your rights.
File an Appeal (CPA, VCDPA, CTDPA)
You have the right to file an appeal based on our response to you exercising any of these rights. In the event you disagree with how we resolved the appeal, you have the right to contact the attorney general located here:
If you are based in Colorado, please visit this website to file a complaint. If you are based in Virginia, please visit this website to file a complaint. If you are based in Connecticut, please visit this website to file a complaint.
File a Complaint (GDPR Article 77, LGPD, POPIA)
You have the right to bring a claim before their competent data protection authority. If you are based in the EEA, please visit this website (http://ec.europa.eu/newsroom/article29/document.cfm?action=display&doc_id=50061) for a list of local data protection authorities.
If you have consented to our processing of your Personal Data, you have the right to withdraw your consent at any time, free of charge, such as where you wish to opt out from marketing messages that you receive from us. If you wish to withdraw your consent, please contact us using the information found at the bottom of this page.
You can make a request to exercise any of these rights in relation to your Personal Data by sending the request to our privacy team by using the form below.
For your own privacy and security, at our discretion, we may require you to prove your identity before providing the requested information.
We may modify this Policy at any time. If we make changes to this Policy then we will post an updated version of this Policy at this website. When using our services, you will be asked to review and accept our Privacy Policy. In this manner, we may record your acceptance and notify you of any future changes to this Policy.
To request a copy for your information, unsubscribe from our email list, request for your data to be deleted, or ask a question about your data privacy, we've made the process simple:
Our aim is to keep this Agreement as readable as possible, but in some cases for legal reasons, some of the language is required "legalese".
These terms of service are entered into by and between You and Scry Analytics, Inc., ("Company," "we," "our," or "us"). The following terms and conditions, together with any documents they expressly incorporate by reference (collectively "Terms of Service"), govern your access to and use of www.scryai.com, including any content, functionality, and services offered on or through www.scryai.com (the "Website").
Please read the Terms of Service carefully before you start to use the Website.
By using the Website [or by clicking to accept or agree to the Terms of Service when this option is made available to you], you accept and agree to be bound and abide by these Terms of Service and our Privacy Policy, found at Privacy Policy, incorporated herein by reference. If you do not want to agree to these Terms of Service, you must not access or use the Website.
Accept and agree to be bound and comply with these terms of service. You represent and warrant that you are the legal age of majority under applicable law to form a binding contract with us and, you agree if you access the website from a jurisdiction where it is not permitted, you do so at your own risk.
We may revise and update these Terms of Service from time to time in our sole discretion. All changes are effective immediately when we post them and apply to all access to and use of the Website thereafter.
Continuing to use the Website following the posting of revised Terms of Service means that you accept and agree to the changes. You are expected to check this page each time you access this Website so you are aware of any changes, as they are binding on you.
You are required to ensure that all persons who access the Website are aware of this Agreement and comply with it. It is a condition of your use of the Website that all the information you provide on the Website is correct, current, and complete.
You are solely and entirely responsible for your use of the website and your computer, internet and data security.
You may use the Website only for lawful purposes and in accordance with these Terms of Service. You agree not to use the Website:
The Website and its entire contents, features, and functionality (including but not limited to all information, software, text, displays, images, video, and audio, and the design, selection, and arrangement thereof) are owned by the Company, its licensors, or other providers of such material and are protected by United States and international copyright, trademark, patent, trade secret, and other intellectual property or proprietary rights laws.
These Terms of Service permit you to use the Website for your personal, non-commercial use only. You must not reproduce, distribute, modify, create derivative works of, publicly display, publicly perform, republish, download, store, or transmit any of the material on our Website, except as follows:
You must not access or use for any commercial purposes any part of the website or any services or materials available through the Website.
If you print, copy, modify, download, or otherwise use or provide any other person with access to any part of the Website in breach of the Terms of Service, your right to use the Website will stop immediately and you must, at our option, return or destroy any copies of the materials you have made. No right, title, or interest in or to the Website or any content on the Website is transferred to you, and all rights not expressly granted are reserved by the Company. Any use of the Website not expressly permitted by these Terms of Service is a breach of these Terms of Service and may violate copyright, trademark, and other laws.
The Website may provide you with the opportunity to create, submit, post, display, transmit, public, distribute, or broadcast content and materials to us or in the Website, including but not limited to text, writings, video, audio, photographs, graphics, comments, ratings, reviews, feedback, or personal information or other material (collectively, "Content"). You are responsible for your use of the Website and for any content you provide, including compliance with applicable laws, rules, and regulations.
All User Submissions must comply with the Submission Standards and Prohibited Activities set out in these Terms of Service.
Any User Submissions you post to the Website will be considered non-confidential and non-proprietary. By submitting, posting, or displaying content on or through the Website, you grant us a worldwide, non-exclusive, royalty-free license to use, copy, reproduce, process, disclose, adapt, modify, publish, transmit, display and distribute such Content for any purpose, commercial advertising, or otherwise, and to prepare derivative works of, or incorporate in other works, such as Content, and grant and authorize sublicenses of the foregoing. The use and distribution may occur in any media format and through any media channels.
We do not assert any ownership over your Content. You retain full ownership of all of your Content and any intellectual property rights or other proprietary rights associated with your Content. We are not liable for any statement or representations in your Content provided by you in any area in the Website. You are solely responsible for your Content related to the Website and you expressly agree to exonerate us from any and all responsibility and to refrain from any legal action against us regarding your Content. We are not responsible or liable to any third party for the content or accuracy of any User Submissions posted by you or any other user of the Website. User Submissions are not endorsed by us and do not necessarily represent our opinions or the view of any of our affiliates or partners. We do not assume liability for any User Submission or for any claims, liabilities, or losses resulting from any review.
We have the right, in our sole and absolute discretion, (1) to edit, redact, or otherwise change any Content; (2) to recategorize any Content to place them in more appropriate locations in the Website; and (3) to prescreen or delete any Content at any time and for any reason, without notice. We have no obligation to monitor your Content. Any use of the Website in violation of these Terms of Service may result in, among other things, termination or suspension of your right to use the Website.
These Submission Standards apply to any and all User Submissions. User Submissions must in their entirety comply with all the applicable federal, state, local, and international laws and regulations. Without limiting the foregoing, User Submissions must not:
We have the right, without provision of notice to:
You waive and hold harmless company and its parent, subsidiaries, affiliates, and their respective directors, officers, employees, agents, service providers, contractors, licensors, licensees, suppliers, and successors from any and all claims resulting from any action taken by the company and any of the foregoing parties relating to any, investigations by either the company or by law enforcement authorities.
For your convenience, this Website may provide links or pointers to third-party sites or third-party content. We make no representations about any other websites or third-party content that may be accessed from this Website. If you choose to access any such sites, you do so at your own risk. We have no control over the third-party content or any such third-party sites and accept no responsibility for such sites or for any loss or damage that may arise from your use of them. You are subject to any terms and conditions of such third-party sites.
This Website may provide certain social media features that enable you to:
You may use these features solely as they are provided by us and solely with respect to the content they are displayed with. Subject to the foregoing, you must not:
The Website from which you are linking, or on which you make certain content accessible, must comply in all respects with the Submission Standards set out in these Terms of Service.
You agree to cooperate with us in causing any unauthorized framing or linking immediately to stop.
We reserve the right to withdraw linking permission without notice.
We may disable all or any social media features and any links at any time without notice in our discretion.
You understand and agree that your use of the website, its content, and any goods, digital products, services, information or items found or attained through the website is at your own risk. The website, its content, and any goods, services, digital products, information or items found or attained through the website are provided on an "as is" and "as available" basis, without any warranties or conditions of any kind, either express or implied including, but not limited to, the implied warranties of merchantability, fitness for a particular purpose, or non-infringement. The foregoing does not affect any warranties that cannot be excluded or limited under applicable law.
You acknowledge and agree that company or its respective directors, officers, employees, agents, service providers, contractors, licensors, licensees, suppliers, or successors make no warranty, representation, or endorsement with respect to the completeness, security, reliability, suitability, accuracy, currency, or availability of the website or its contents or that any goods, services, digital products, information or items found or attained through the website will be accurate, reliable, error-free, or uninterrupted, that defects will be corrected, that our website or the server that makes it available or content are free of viruses or other harmful components or destructive code.
Except where such exclusions are prohibited by law, in no event shall the company nor its respective directors, officers, employees, agents, service providers, contractors, licensors, licensees, suppliers, or successors be liable under these terms of service to you or any third-party for any consequential, indirect, incidental, exemplary, special, or punitive damages whatsoever, including any damages for business interruption, loss of use, data, revenue or profit, cost of capital, loss of business opportunity, loss of goodwill, whether arising out of breach of contract, tort (including negligence), any other theory of liability, or otherwise, regardless of whether such damages were foreseeable and whether or not the company was advised of the possibility of such damages.
To the maximum extent permitted by applicable law, you agree to defend, indemnify, and hold harmless Company, its parent, subsidiaries, affiliates, and their respective directors, officers, employees, agents, service providers, contractors, licensors, suppliers, successors, and assigns from and against any claims, liabilities, damages, judgments, awards, losses, costs, expenses, or fees (including reasonable attorneys' fees) arising out of or relating to your breach of these Terms of Service or your use of the Website including, but not limited to, third-party sites and content, any use of the Website's content and services other than as expressly authorized in these Terms of Service or any use of any goods, digital products and information purchased from this Website.
At Company’s sole discretion, it may require you to submit any disputes arising from these Terms of Service or use of the Website, including disputes arising from or concerning their interpretation, violation, invalidity, non-performance, or termination, to final and binding arbitration under the Rules of Arbitration of the American Arbitration Association applying Ontario law. (If multiple jurisdictions, under applicable laws).
Any cause of action or claim you may have arising out of or relating to these terms of use or the website must be commenced within 1 year(s) after the cause of action accrues; otherwise, such cause of action or claim is permanently barred.
Your provision of personal information through the Website is governed by our privacy policy located at the "Privacy Policy".
The Website and these Terms of Service will be governed by and construed in accordance with the laws of the Province of Ontario and any applicable federal laws applicable therein, without giving effect to any choice or conflict of law provision, principle, or rule and notwithstanding your domicile, residence, or physical location. Any action or proceeding arising out of or relating to this Website and/or under these Terms of Service will be instituted in the courts of the Province of Ontario, and each party irrevocably submits to the exclusive jurisdiction of such courts in any such action or proceeding. You waive any and all objections to the exercise of jurisdiction over you by such courts and to the venue of such courts.
If you are a citizen of any European Union country or Switzerland, Norway or Iceland, the governing law and forum shall be the laws and courts of your usual place of residence.
The parties agree that the United Nations Convention on Contracts for the International Sale of Goods will not govern these Terms of Service or the rights and obligations of the parties under these Terms of Service.
If any provision of these Terms of Service is illegal or unenforceable under applicable law, the remainder of the provision will be amended to achieve as closely as possible the effect of the original term and all other provisions of these Terms of Service will continue in full force and effect.
These Terms of Service constitute the entire and only Terms of Service between the parties in relation to its subject matter and replaces and extinguishes all prior or simultaneous Terms of Services, undertakings, arrangements, understandings or statements of any nature made by the parties or any of them whether oral or written (and, if written, whether or not in draft form) with respect to such subject matter. Each of the parties acknowledges that they are not relying on any statements, warranties or representations given or made by any of them in relation to the subject matter of these Terms of Service, save those expressly set out in these Terms of Service, and that they shall have no rights or remedies with respect to such subject matter otherwise than under these Terms of Service save to the extent that they arise out of the fraud or fraudulent misrepresentation of another party. No variation of these Terms of Service shall be effective unless it is in writing and signed by or on behalf of Company.
No failure to exercise, and no delay in exercising, on the part of either party, any right or any power hereunder shall operate as a waiver thereof, nor shall any single or partial exercise of any right or power hereunder preclude further exercise of that or any other right hereunder.
We may provide any notice to you under these Terms of Service by: (i) sending a message to the email address you provide to us and consent to us using; or (ii) by posting to the Website. Notices sent by email will be effective when we send the email and notices we provide by posting will be effective upon posting. It is your responsibility to keep your email address current.
To give us notice under these Terms of Service, you must contact us as follows: (i) by personal delivery, overnight courier or registered or certified mail to Scry Analytics Inc. 2635 North 1st Street, Suite 200 San Jose, CA 95134, USA. We may update the address for notices to us by posting a notice on this Website. Notices provided by personal delivery will be effective immediately once personally received by an authorized representative of Company. Notices provided by overnight courier or registered or certified mail will be effective once received and where confirmation has been provided to evidence the receipt of the notice.
To request a copy for your information, unsubscribe from our email list, request for your data to be deleted, or ask a question about your data privacy, we've made the process simple: